Tableau Dashboard - IAPT services 2021-22 Annual Report by Integrated Care Boards
This dashboard uses data from the annual report Improving Access to Psychological Therapies (IAPT) programme from 1st April 2021 to 31st March 2022.
This is the type of stuff I get up to.

This dashboard uses data from the annual report Improving Access to Psychological Therapies (IAPT) programme from 1st April 2021 to 31st March 2022.

Advent of Code is an Advent calendar of small programming puzzles for a variety of skill sets and skill levels that can be solved in any programming language you like.

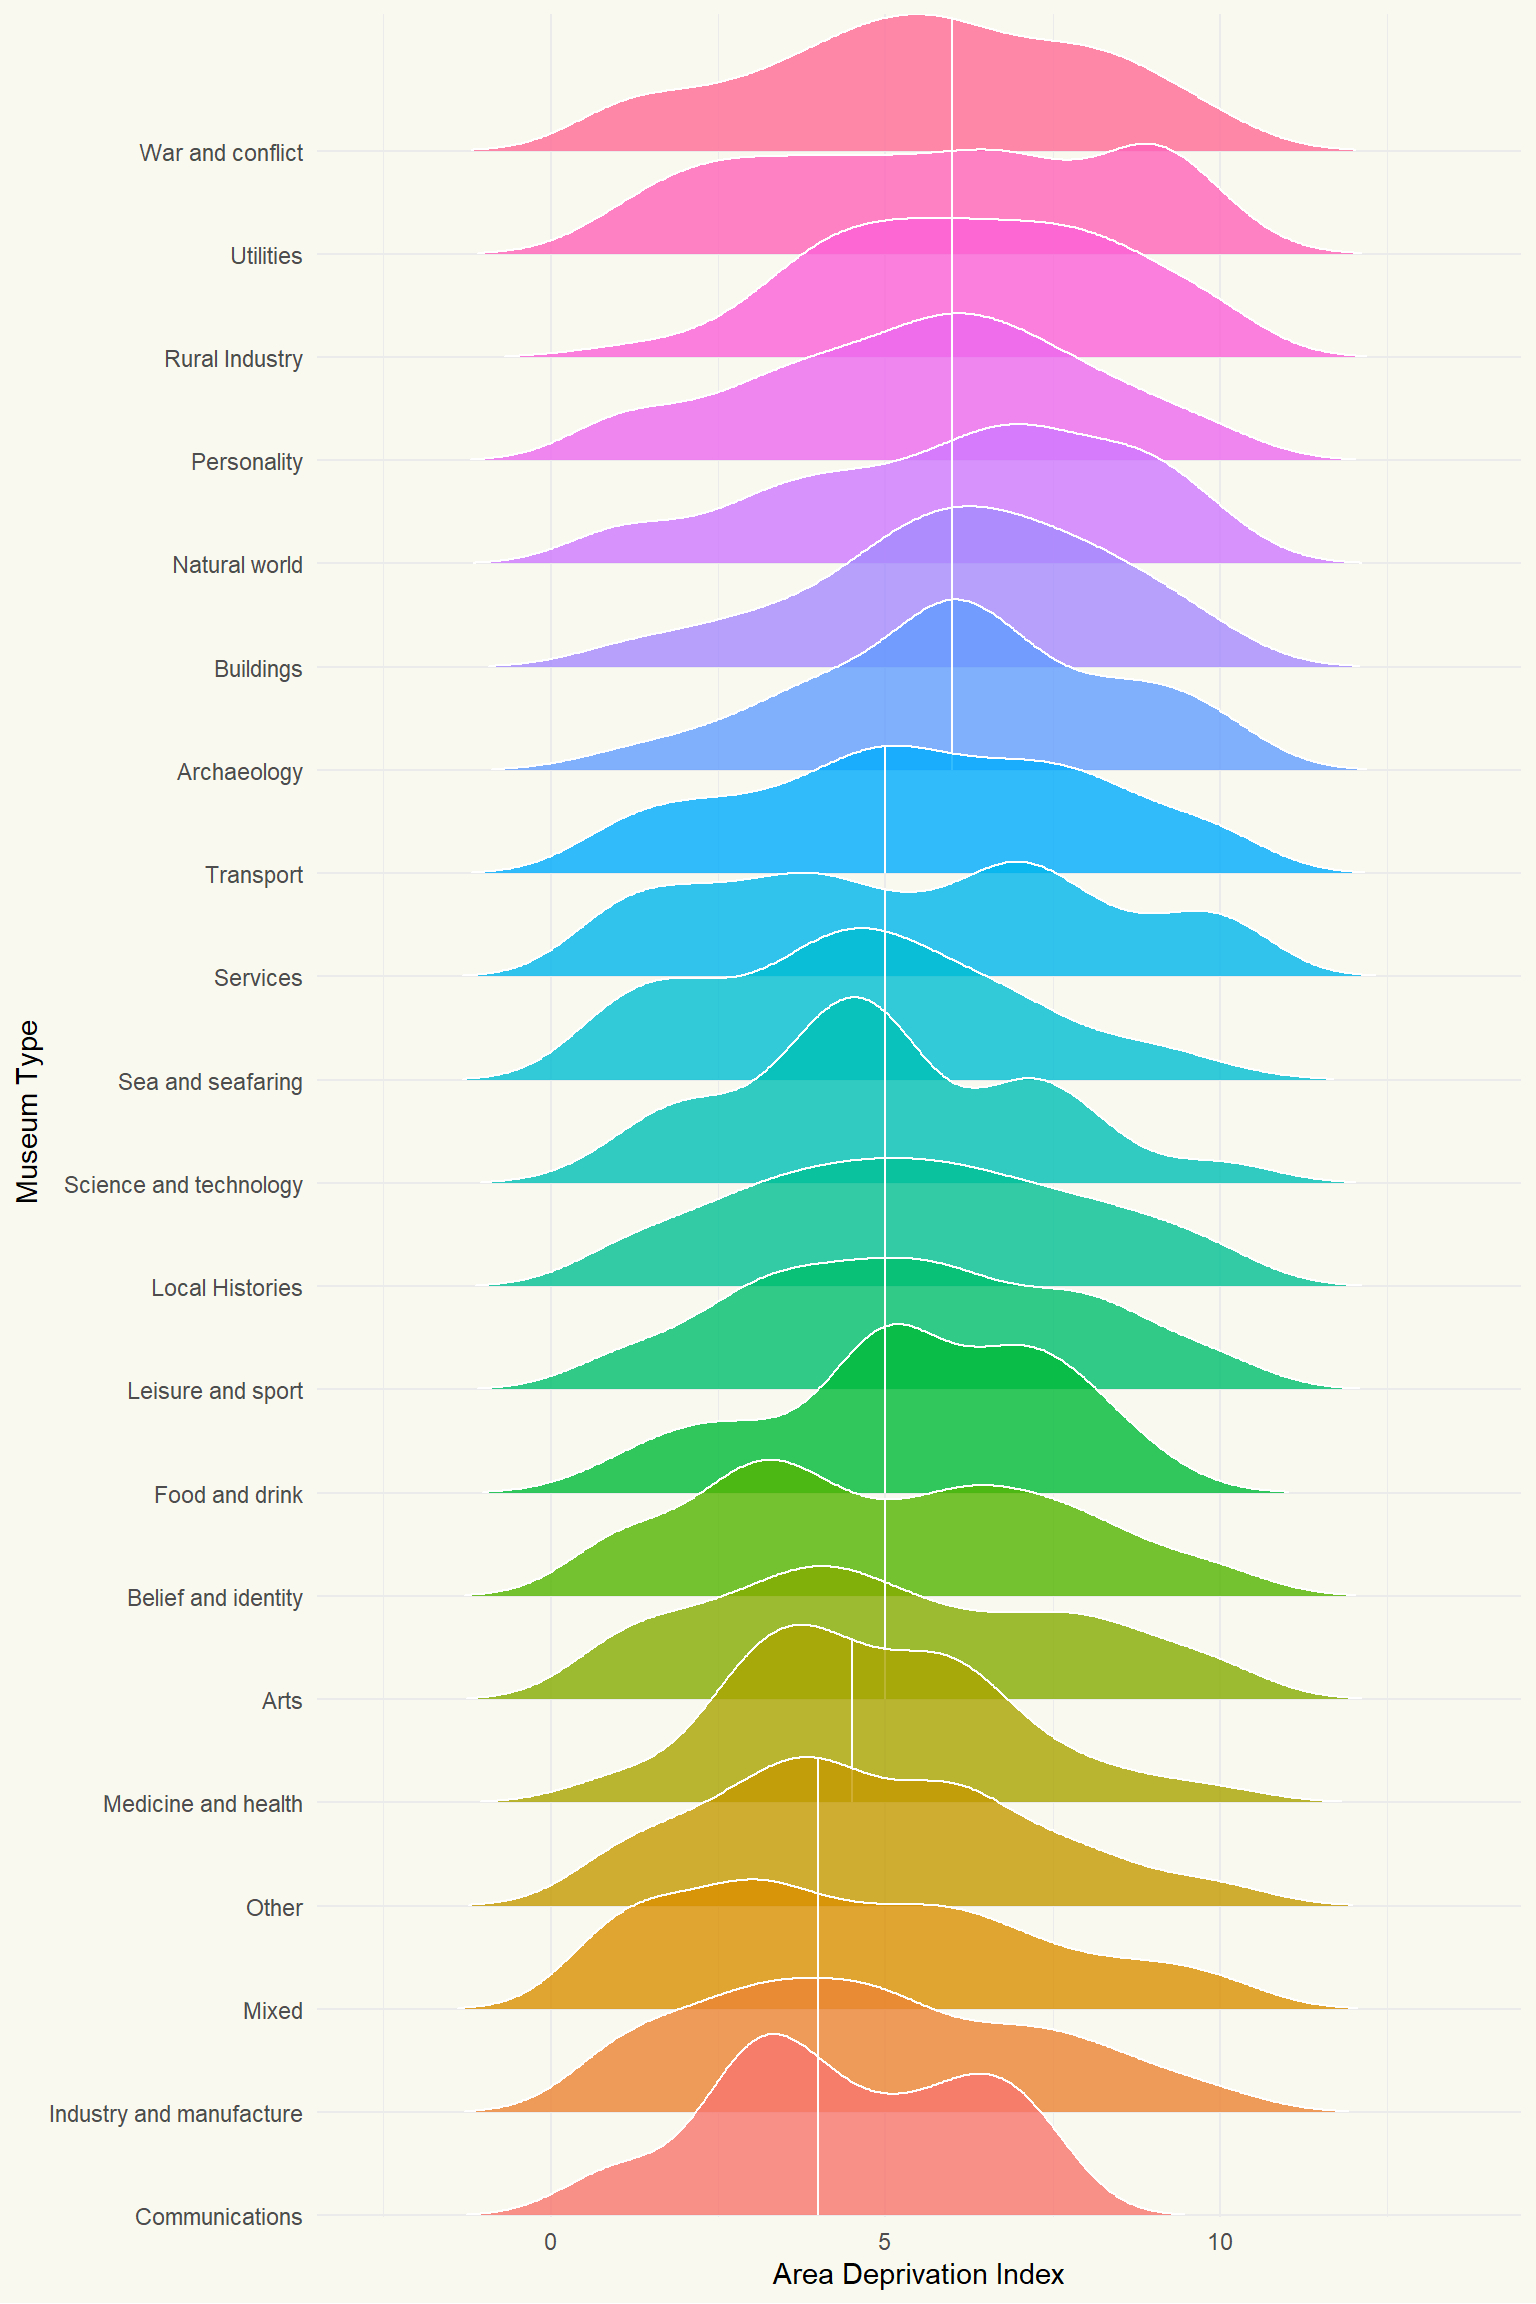
This weeks data comes from the Mapping Museums Project. They have gathered, cleansed and codified data relating to over 4000 UK Museums. They have also included some demographic information relating to the location of the museum - for example the Index of Multiple Deprivation (IMD). IMD measures the relative deprivation of geographic areas in the UK, aggregating different dimensions (income, employment, education, health, crime, housing, and living environment). The index ranges from 1 (most deprived) to 10 (least deprived).

In this tutorial, I’ll show you how to use R and rvest to obtain the transcripts of all episodes of It’s Always Sunny in Philadelphia. Let’s get started!